# Week 2
# Wat is p5.js?
p5.js (opens new window) is een JavaScript bibliotheek gebasseerd op de doelen van Processing (opens new window) (Pyhton bibliotheek) om programmeren toegankelijk te maken voor beginners, studenten, docenten, ontwerpers, kunstenaars …
p5.js is een soort schetsboek op het web en bevat een verzameling van objecten en methoden om graphics te genereren op deze schetsboek.
p5.js kan uitgebreid worden met extra bibliotheken (opens new window) en dus ook functionaliteiten om te intrageren met: het document object model, afbeeldingen, geluid, video …
p5.js is voornamelijk een wrapper bovenop de Canvas API (opens new window).
# Setup
Maak een folder aan met een naam die een indicatie geeft aan de webapplicatie, bijv.: p5_android_character. De folder bevat de volgende structuur:
p5_android_character(folder)js(folder)main.js(file)
index.html(file)
De HTML pagina ziet er als volgt uit:
<!DOCTYPE html>
<html lang="en">
<head>
    <meta charset="UTF-8">
    <meta name="viewport" content="width=device-width, initial-scale=1.0">
    <meta http-equiv="X-UA-Compatible" content="ie=edge">
    <title>Web Programming 1: Front-End Development | Associate Degree in Computer Programming</title>
    <link rel="stylesheet" href="css/main.css">
</head>
<body>
    <script src="https://cdnjs.cloudflare.com/ajax/libs/p5.js/0.9.0/p5.js"></script>
    <script src="js/main.js"></script>
</body>
</html>
2
3
4
5
6
7
8
9
10
11
12
13
14
De p5.js bibliotheek wordt, in het HTML-bestand, gelinkt via het <script> element. In het src attribuut vermelden we het pad naar het JavaScript-bestand dat we wensen te linken. Dat kan een absoluut (lokaal) of relatief (via httpof https) pad zijn. We kiezen in dit geval voor een absoluut pad naar een online resource. p5.js wordt o.a. gehost in een CDN (Content Delivery Network).
We linken vervolgens een lokaal (relatief pad ten opzichte van het HTML-bestand) JavaScript-bestand main.js waarin we onze eigen code (Eng. custom code) zullen schrijven. Dit bestand bevat minstens twee ingebouwde functies uit p5.js, namelijk setup() (dit zijn de initiële settings van onze p5.js app) en draw (waarin we o.a. graphics zullen tekenen).
Het JavaScript-bestand bevat de volgende inhoud:
function setup() {
  noLoop();
}

function draw() {

}
2
3
4
5
6
7
De setup() (opens new window) methode wordt maar één keer aangeroepen wanneer het programma start. Het wordt voornamelijk gebruikt om omgevingseigenschappen in te stellen, zoals: schermgrootte, achtergrondkleur, éénmalig laden van media (afbeeldingen, audio, video, fonts …).
De draw() (opens new window) methode wordt direct uitgevoerd na de setup() methode. De draw() methode wordt continue uitgevoerd indien er geen noLoop() methode gedefinieerd is in de setup() of draw() methode. Indien noLoop() vermeld wordt in de setup() methode, dan zal de draw() éénmaal uitgevoerd worden. Kortom, voor animaties verwijder je de noLoop() methode.
# Onze eerste schets in p5.js
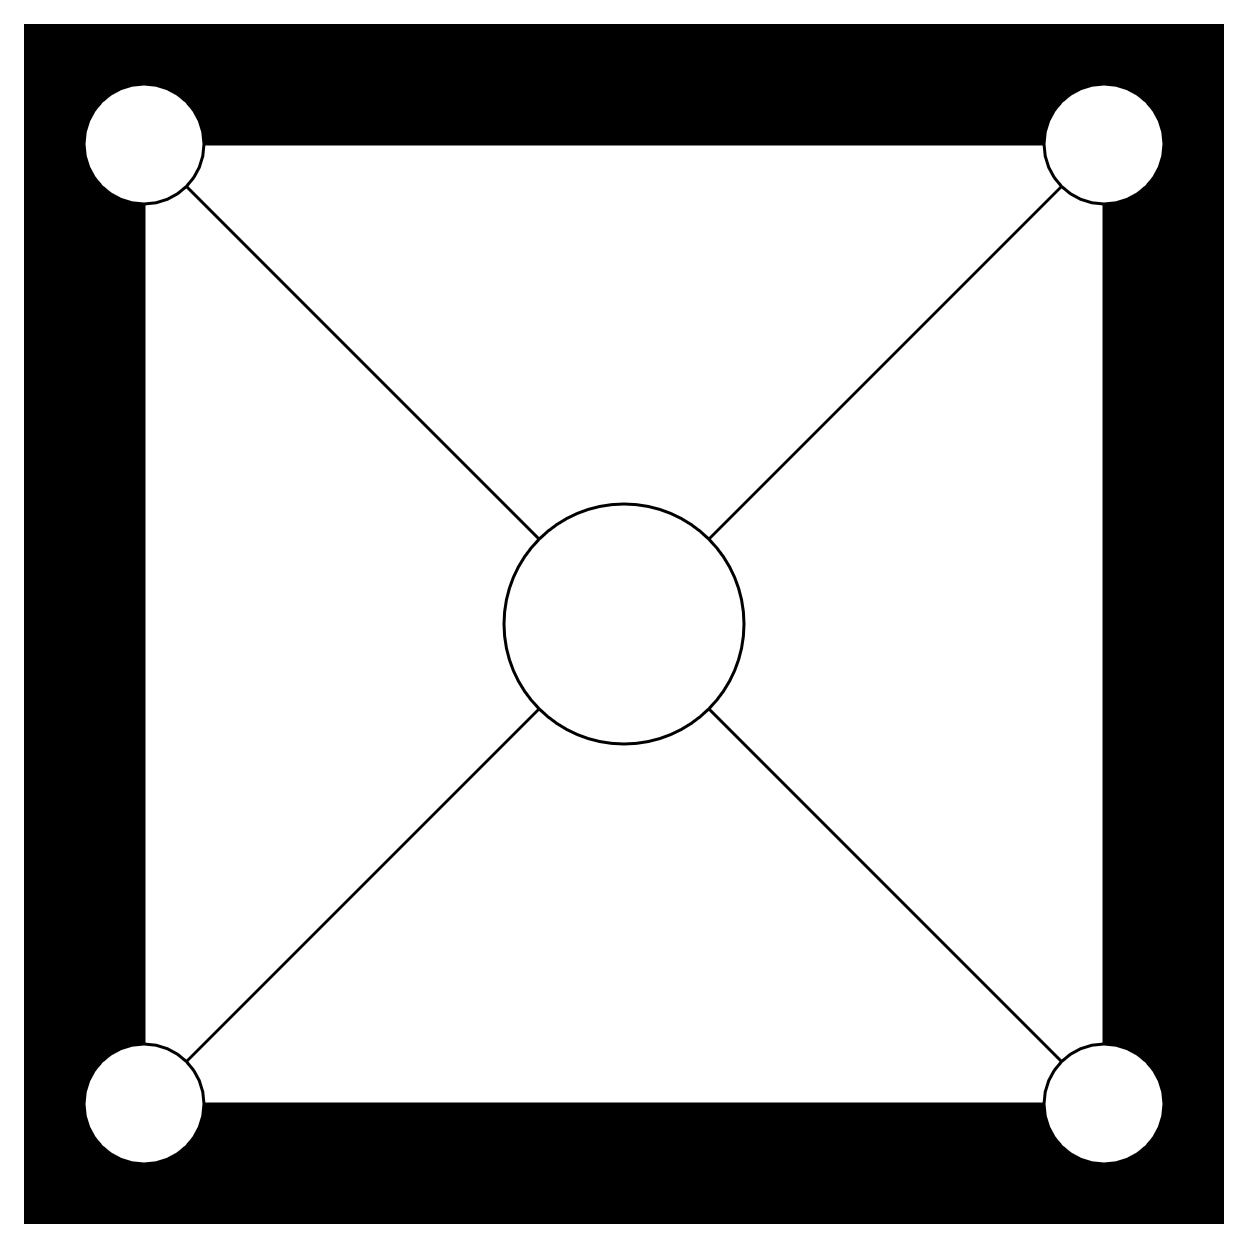
Na de voorgaande setup te doorlopen zullen we ons eerste p5.js schets maken. Deze schets is statisch (via de noLoop()) methode en bevat een reeks van graphics die “laag boven laag” getekend zullen worden cfr. de lagen in Adobe Photoshop CC of Adobe Illustrator CC.
In de setup() functie creëren we een nieuwe canvas (via de Canvas API) met de dimensie van 600 pixels breed en 600 pixels hoog. We voegen geen animatie toe door de noLoop() methode aan te spreken. Het achtergrondkleur van de canvas stellen we in op zwart via de methode background(0).
function setup() {
  createCanvas(400, 400);
  noLoop();
  background(0);
}

function draw() {
  rect(40, 40, width-80, height-80);
  line(40, 40, width-40, height-40);
  line(width-40, 40, 40, height-40);
  ellipse(40, 40, 40, 40);
  ellipse(width-40, 40, 40, 40);
  ellipse(width-40, height-40, 40, 40);
  ellipse(40, height-40, 40, 40);
  ellipse(width/2, height/2, 80, 80);
}
2
3
4
5
6
7
8
9
10
11
12
13
14
15
16
In de draw() methode tekenen we de vormen die we wensen te generen binnen het <canvas> element. We tekenen eerst een rechthoek die start op positie (40, 40) met een breedte gelijke aan de breedte (width eigenschap) van de canvas vermindert met 80 en een hoogte gelijk aan de hoogte van de canvas (height eigenschap) vermindert met 80. We trekken twee spiegelende diagonale lijnen binnen dit vierkant. In elke hoek tekenen we een cirkel via de ellipse() methode. Tenslotte tekenen we ook een cirkel met een bepaalde dimensie in het midden van de rechthoek.
Resultaat:
# Full width and height of the viewport
We breiden de mappenstructuur uit met een CSS-bestand waarin we opmaak kunnen coderen zodanig dat elke canvas element de volledige beschikbare breedte en hoogte gebruikt van het browservenster. De mannenstructuur ziet er nu als volgt uit:
hoofdmap(folder)js(folder)main.js(file)
css(folder)main.css(file)
index.html(file)
De HTML pagina ziet er als volgt uit:
<!DOCTYPE html>
<html lang="en">
<head>
    <meta charset="UTF-8">
    <meta name="viewport" content="width=device-width, initial-scale=1.0">
    <meta http-equiv="X-UA-Compatible" content="ie=edge">
    <title>Web Programming 1: Front-End Development | Associate Degree in Computer Programming</title>
    <link rel="stylesheet" href="css/main.css">
</head>
<body>
    <script src="https://cdnjs.cloudflare.com/ajax/libs/p5.js/0.9.0/p5.js"></script>
    <script src="js/main.js"></script>
</body>
</html>
2
3
4
5
6
7
8
9
10
11
12
13
14
De opmaak zorgt ervoor dat we de volledige breedte en hoogte in de webbrowser kunnen gebruiken voor onze toekomstige schetsboek. Als je niet de volledige breedte en hoogte nodig hebt dan verwijder je gewoon de canvas selector.
Het CSS-bestand bevat de volgende inhoud:
html, body {
    margin: 0;
    padding: 0;

    background: rgba(0, 0, 0, 1);
}
canvas {
    display: block;
    width: 100vw;
    height: 100vh;

    overflow: hidden;
}
2
3
4
5
6
7
8
9
10
11
12
13
Het JavaScript-bestand main.js ziet er als volgt uit:
function setup() {
  createCanvas(windowWidth, windowHeight); // canvas bevat de volledige breedte en hoogte van de viewport
  background(0); // achtergrondkleur van de canvas is zwart
}

function draw() {
}
2
3
4
5
6
7
# Voorbeelden
# Enlarge and Shrinking
In dit voorbeeld maken we een bol met de volgende eigenschappen:
- gecentreerd in het center van de canvas
- de bol start met een dimensie van
[0, 0]en groeit per frame, de dimensie wordt bijgehouden door de variabeler - indien de bol breeder wordt dan de canvas, dan wordt de groeirichting gewijzigd (groeien wordt krimpen)
- de groeirichting wordt bepaald door de variabele
direction - indien de bol kleiner wordt dan
0, dan wordt de groeirichting gewijzigd (krimpen wordt groeien) - de snelheid van groeien en krimpen wordt ingesteld via de variabele
speed
De code:
/*
Variables
*/
let r = 0; // Size of the elippse
let speed = 10; // Speed of the animation for the ellipse
let direction = 1; // 1: enlarge, -1: shrink

function setup() {
    createCanvas(windowWidth, windowHeight); // canvas bevat de volledige breedte en hoogte van de viewport
    background(0); // achtergrondkleur van de canvas is zwart
}

function draw() {
    background(0);
    ellipse(width/2, height/2, r, r);
    if((r + speed) > width) {
        direction = -1;
    } else if ((r - speed) < 0) {
        direction = 1;
    }
    // speed += 2; // acceleration
    r += speed*direction;
}
2
3
4
5
6
7
8
9
10
11
12
13
14
15
16
17
18
19
20
21
22
23
# Rectangle Height Shrink Animated
In dit voorbeeld maken we een rechthoeken die van hoogte verminderen en opschuiven in de positieve x-richting. Defineer de variabelen:
xde x-positie van een rechthoekwde breedte van een rechthoekhde hoogte van de rechthoek variabel per frame
De code:
/*
Variables
*/
let x = 0; // position of the current rectangle
let w = 20; // width of a rectangle
let h = 0;

function setup() {
    createCanvas(windowWidth, windowHeight); // canvas bevat de volledige breedte en hoogte van de viewport
    background(0); // achtergrondkleur van de canvas is zwart
    noStroke(); // no border

    h = height; // start height of the first rectangle
    rectMode(CENTER);
}

function draw() {
    //background(0);
    if(x > width) {
        // Stop generating rectangles
        background(255,0,0);
    } else {
        fill(random(0,255), random(0,255), random(0,255));
        rect(x, height/2, w, h); // draw a rectangle
        x += w;
        h -= w/2;
    }
}
2
3
4
5
6
7
8
9
10
11
12
13
14
15
16
17
18
19
20
21
22
23
24
25
26
27
28
# Square Animated
In dit voorbeeld maken we een rechthoeken (waarvan de dimensie afneemt totdat de breedte of hoogte van een volgende rechthoek kleiner wordt dan 0) met de volgende eigenschappen:
- gecentreerd in het center van de canvas
- een rechthoek start met een dimensie van
[width, height]de volledige beschikbare breedte en hoogte van de canvas - de volgende rechthoeken (wordt per frame getekend) worden kleiner en kleiner, de dimensie wordt bijgehouden door de variabelen
rWenrH - indien de volgende rechthoek een breedte of hoogte heeft die kleiner is dan
0, dan wordt de het tekenen van rechthoeken gestopt - op het einde van de animatie wordt een rode rechthoek getekend maar daarop de tekst “LOVE CODE”
De code:
/*
Variables
*/
let rW = 10;
let rH = 10;
let speed = 20;
let fontRegular;

function preload() {
    fontRegular = loadFont('assets/fonts/SourceCodePro-Regular.ttf');
}

function setup() {
    createCanvas(windowWidth, windowHeight); // canvas bevat de volledige breedte en hoogte van de viewport
    background(0); // achtergrondkleur van de canvas is zwart
    //noStroke(); // no border

    rectMode(CENTER);

    rW = width;
    rH = height;
}

function draw() {
    if(rW > 0 && rH > 0) {
        rect(width/2, height/2, rW, rH);
        rW -= speed;
        rH -= speed;
    } else {
        fill(255, 0, 0, 200);
        rect(width/2, height/2, width*0.8, height*0.25);
        textFont(fontRegular);
        textSize(height*0.1);
        textAlign(CENTER);
        strokeWeight(16);
        fill(255);
        text('LOVE CODE', width/2, height/2+(textDescent()));
    }
}
2
3
4
5
6
7
8
9
10
11
12
13
14
15
16
17
18
19
20
21
22
23
24
25
26
27
28
29
30
31
32
33
34
35
36
37
38
39
# Operating System Information
Maak een bestand operating_system_info.js aan in de reeds aangemaakt folder week-1. In deze applicatie lijsten we informatie op van ons besturingssysteem.
Voorbeeld output:
Homefolder:     /Users/drdynscript
Temp folder:    /var/folders/w1/c68647g15894_84z3mygb8sr0000gn/T
Hostname:       MacBook-Pro-van-Philippe.local
Platform:       darwin
Release:        18.7.0
Architecture:   x64
Total Memory:   8GB
Free Memory:    37.703125MB
Percent used:   99.54%
Uptime:         11722s
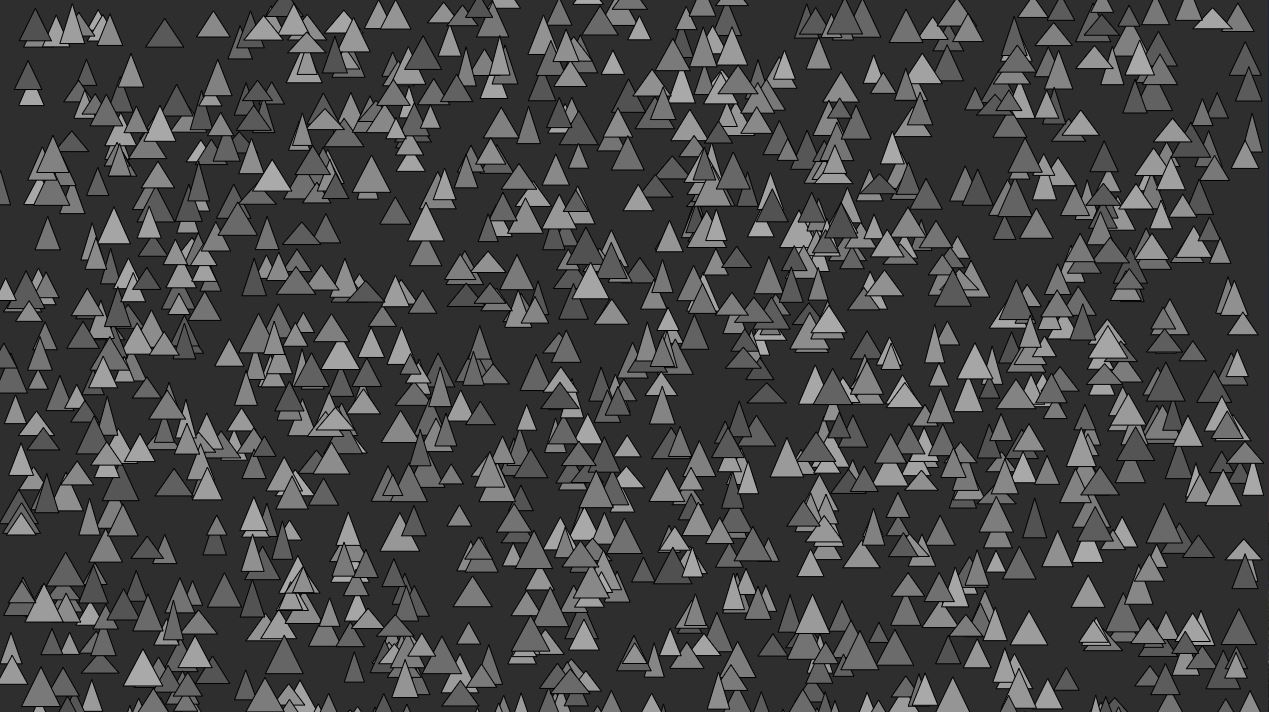
# Art
Maak een folder art aan met de mappenstructuur uit p5.js introductie. Deze applicatie genereert een verzameling van rechthoeken (zonder animatie) in grijstinten en op random posities.
Resultaat:
 **Oplossing**:
./artevelde/pgm-code/pgm-1/week-2/art.js
const n = 2000;
const gmin = 80;
const gmax = 170;
const fmin = Math.floor(n/6);
const fmax = 50;

function setup() {
    createCanvas(windowWidth, windowHeight);
    background(46);
    noLoop();
}

function draw() {
    background(46);
    for(let i = 0; i < n ; i++) {
        const w = random(40, 20);
        const h = random(40, 20);
        const x = random(0, width-w);
        const y = random(h, height);
        const g = random(gmin, gmax);
        drawTriangle(x, y, w, h, 0, g)
    }
}

function drawTriangle(x, y, w, h, rotation, g) {
    fill(g);
    triangle(x, y, x+w, y, x+w/2, y-h);
}2
3
4
5
6
7
8
9
10
11
12
13
14
15
16
17
18
19
20
21
22
23
24
25
26
27
# Bouncing circle
Maak een folder circle_bouncing aan met de mappenstructuur uit p5.js introductie. Teken een cirkel binnen deze methode startend op een random postie. Laat deze cirkel botsen tegen alle kanten van de canvas.
Resultaat:
 **Oplossing**:
./artevelde/pgm-code/pgm-1/week-2/bouncing_circle.js
/*
Variables
---------------------------------------------------
r:        the radius of the ball
x:        the start position of the ball around the X-axis
y:        the start position of the ball around the Y-axis
xSpeed:   the speed of the ball around the X-axis
YSpeed:   the speed of the ball around the Y-axis
*/
let r = 20, x = r, y = r, xSpeed = 10, ySpeed = 10;

// The setup of the p5.js application. This function will called once.
function setup() {
  createCanvas(windowWidth, windowHeight);

  background(0);
  stroke(255);

  xSpeed = 10+Math.floor(random(0, 6));
  ySpeed = 10+Math.floor(random(0, 6));
}

// The draw method of the p5.js application. By default it will be called 60 times per second.
function draw() {
  background(0);

  x += xSpeed;
  y += ySpeed;

  // when x value is greater than the width of the canvas (and the half of myself) or when the x value is lower than the half of myself, reverse the speed
  if((x > (width - r)) || (x < (0 + r))) {
    xSpeed *= -1;
  }

  // when y value is greater than the height of the canvas (and the half of myself) or when the y value is lower than the half of myself, reverse the speed
  if((y > (height - r)) || (y < (0 + r))) {
    ySpeed *= -1;
  }

  ellipse(x, y, r, r); // Draw an ellipse at a certain position and dimension
}2
3
4
5
6
7
8
9
10
11
12
13
14
15
16
17
18
19
20
21
22
23
24
25
26
27
28
29
30
31
32
33
34
35
36
37
38
39
40
# Random walker
Maak een folder walker_random aan met de mappenstructuur uit p5.js introductie. Deze applicatie simuleert een wandelaar die bij iedere nieuwe frame beweegt (t.o.v. de vorige positie), hetzij (één van de 4 toestanden):
- een aantal pixels naar boven
- een aantal pixels naar beneden
- een aantal pixels naar rechts
- een aantal pixels naar links
De wandelaar vertrekt vanuit het midden van de canvas. De richting die de wandelaar maakt is één van de vier toestanden. De verplaatsing wordt weergegeven met een verbindingslijn tussen de huidige postie en de nieuwe positie.
Resultaat:
 **Oplossing**:
./artevelde/pgm-code/pgm-1/week-2/random_walker.js
let x = 0,
  y = 0; // Declare and assign variables x and y

function setup() {
  createCanvas(windowWidth, windowHeight);
  background(0);

  x = width / 2; // Default position of x in the middle of the canvas width
  y = height / 2; // Default position of y in the middle of the canvas height

  stroke(255);
}

function draw() {
  /*
  Define the mode of the direction:
  - 1 => right
  - 2 => left
  - 3 => bottom (downwards)
  - 4 => top (upwards)
  */
  const mode = 1 + Math.floor(Math.random() * 4);
  let dx = 1 + Math.round(Math.random() * 6); // Speed along the X-axis
  let dy = 1 + Math.round(Math.random() * 6); // Speed along the Y-axis

  /*
  Conditional statement: switch…case
  */
  switch (mode) {
    case 1:
    default:
      dx *= 1;
      dy = 0;
      break;
    case 2:
      dx *= -1;
      dy = 0;
      break;
    case 3:
      dy *= 1;
      dx = 0;
      break;
    case 4:
      dy *= -1;
      dx = 0;
      break;
  }
  line(x, y, x + dx, y + dy); // Draw a line starting from position [x, y]
  x += dx;
  y += dy;
}
2
3
4
5
6
7
8
9
10
11
12
13
14
15
16
17
18
19
20
21
22
23
24
25
26
27
28
29
30
31
32
33
34
35
36
37
38
39
40
41
42
43
44
45
46
47
48
49
50
51
# 50 shades
# Random colors
Maak een folder 50shades_random_colors aan met de mappenstructuur uit p5.js introductie. Deze applicatie genereert een grid van een aantal rechthoeken. De grid is schervullend. Bij elke nieuwe frame worden de rechthoeken hertekend met een random kleur per rechthoek.
Resultaat:
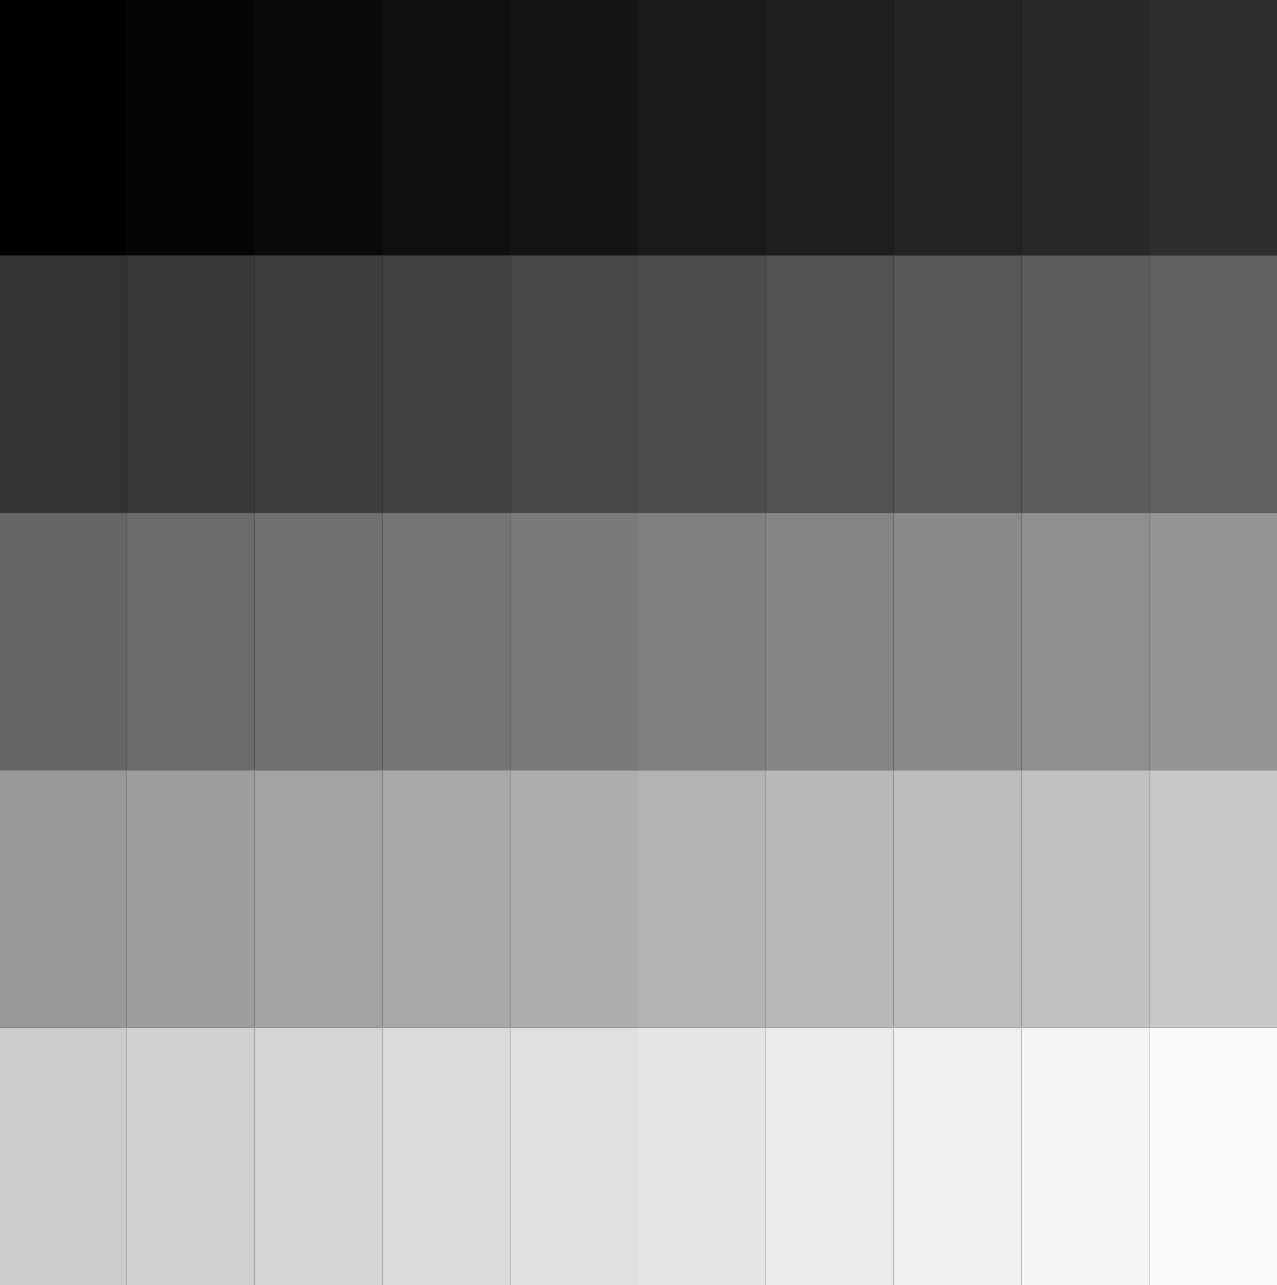
# Grey
Maak een folder 50shades_grey aan met de mappenstructuur uit p5.js introductie. Deze applicatie genereert een grid van een aantal rechthoeken. De grid is schervullend. Het tekenen wordt niet herhaald, vermeld hiervoor de functie noLoop() in de setup() functie. Alle rechthoeken bevatten een grijstint variërend van zwart (linksboven) tot wit (rechtsonder).
Resultaat:
 **Oplossing**:
./artevelde/pgm-code/pgm-1/week-2/50_shades_of_grey.js
/*
50 Shades of grey
===================================================================
Course: Programming 1: Front-End Essentials
Week: 2
Developed by: Philippe De Pauw - Waterschoot
Last updated: 28/09/2020
*/

// Amount of rectangles: 10 columns * 5 rows = 50 items
let cols = 10, rows = 5;

function setup() {
  createCanvas(windowWidth, windowHeight);
  background(0);

  stroke(0);
  strokeWeight(0);

  noLoop(); // Do not loop because there will be no visual update
}

function draw() {
  // Calculate the height of each rectangle based on the available space and rows
  const rH = height / rows;
  // Calculate the width of each rectangle based on the available space and cols
  const rW = width / cols;;

  // The position of a rectangle and the start-color cV (starting with black)
  let x = y = 0, cV = 0;

  // Nested loop: loop through the rows and inside loop through the columns
  for(let r = 0; r < rows; r++) {
    x = 0; // Each new row starts at X-position 0
    for(let c = 0; c < cols; c++) {
      cV = (r*cols+c)*255/(rows*cols); // Calculate the next grey value, each channel has the same value

      fill(color(cV)); // Construct the fill color with use of the value in the variable cV
      rect(x, y, rW, rH);  // Draw a rectangle at a certain position with a certain dimension

      x += rW; // Add the width of an rectangle to the current X-position
    }
    y += rH; // Add the height of an rectangle to the current Y-position
  }
}2
3
4
5
6
7
8
9
10
11
12
13
14
15
16
17
18
19
20
21
22
23
24
25
26
27
28
29
30
31
32
33
34
35
36
37
38
39
40
41
42
43
44
# HSL colors
Maak een folder 50shades_hsl_colors aan met de mappenstructuur uit p5.js introductie. Deze applicatie genereert een grid van een aantal rechthoeken. De grid is schervullend. Bij elke nieuwe frame worden de rechthoeken hertekend met een een nieuwe kleur op basis van HSL (opens new window) (Hue, Saturation en Lightness). De Hue ligt bij iedere frame vast op een random waarde. Dat Saturation is afhankelijk van de kolommen, de Lightness is afhankelijk van de rijen.
Resultaat:
 **Oplossing**:
./artevelde/pgm-code/pgm-1/week-2/50_shades_hsl_colors.js
/*
50 Shades of random colors
===================================================================
Course: Programming 1: Front-End Essentials
Week: 2
Developed by: Philippe De Pauw - Waterschoot
Last updated: 27/09/2020
*/

// Amount of rectangles: 10 columns * 10 rows = 100 items
let cols = 10, rows = 10;

function setup() {
  createCanvas(windowWidth, windowHeight);
  background(0);

  stroke(255);
  strokeWeight(4);
}

function draw() {
  // Calculate the height of each rectangle based on the available space and rows
  const rH = height / rows;
  // Calculate the width of each rectangle based on the available space and cols
  const rW = width / cols;
  // The position of a rectangle
  let x = y = 0;

  // Loop through the amount of rectangles
  for(let i = 0; i < cols*rows; i++) {
    fill(...generateRandomColor()); // Select a random color via the generateRandomColor(), spread the items of the array as individual items, use those arguments to set the fill color of the rectangle
    rect(x, y, rW, rH); // Draw a rectangle at a certain position with a certain dimension

    // Use modulo to check if the next iteration is a new row
    if((i+1) % cols === 0) {
      y += rH; // Add the height of an rectangle to the current Y-position
      x = 0; // Start at X-position 0
    } else {
      x += rW; // Add the width of an rectangle to the current X-position
    }
  }
}

/*
 * function: generateRandomColor() with no parameters
 * Generate a random value between 0 … 255 for each color channel
 * return an array of 3 items: r (red),g (green),b (blue)
*/
function generateRandomColor() {
  const r = Math.floor(Math.random()*256);
  const g = Math.floor(Math.random()*256);
  const b = Math.floor(Math.random()*256);
  return [r, g, b];
}
```

### 50 shades: HSL-colors

```js
/*
50 Shades of HSL-colors
===================================================================
The logic is the same as the exercise 50 shades of grey
===================================================================
Course: Programming 1: Front-End Essentials
Week: 2
Developed by: Philippe De Pauw - Waterschoot
Last updated: 27/09/2020
*/

// Amount of rectangles: 10 columns * 10 rows = 100 items
let cols = 10, rows = 10;

function setup() {
  createCanvas(windowWidth, windowHeight);
  background(0);

  stroke(255);
  strokeWeight(0);

  frameRate(2); // 2 frames per second
}

function draw() {
  const rH = height / rows;
  const rW = width / cols;
  // [x, y] current position, h a random hue value, col the color value to use in order to fill a rectangle
  let x = y = 0, h = Math.floor(Math.random()*361), col = color(255);

  for(let r = 0; r < rows; r++) {
    x = 0;
    for(let c = 0; c < cols; c++) {
      colorMode(HSL);
      // the saturation (second argument) is based on the iterator c and the columns, the lightness is based on the iterator r and the rows
      col = color(h, Math.floor(c*100/cols), 50-Math.floor(r*50/rows));

      fill(col);
      rect(x, y, rW, rH);

      x += rW;
    }
    y += rH;
  }
}2
3
4
5
6
7
8
9
10
11
12
13
14
15
16
17
18
19
20
21
22
23
24
25
26
27
28
29
30
31
32
33
34
35
36
37
38
39
40
41
42
43
44
45
46
47
48
49
50
51
52
53
54
55
56
57
58
59
60
61
62
63
64
65
66
67
68
69
70
71
72
73
74
75
76
77
78
79
80
81
82
83
84
85
86
87
88
89
90
91
92
93
94
95
96
97
98
99
100
101
102
103
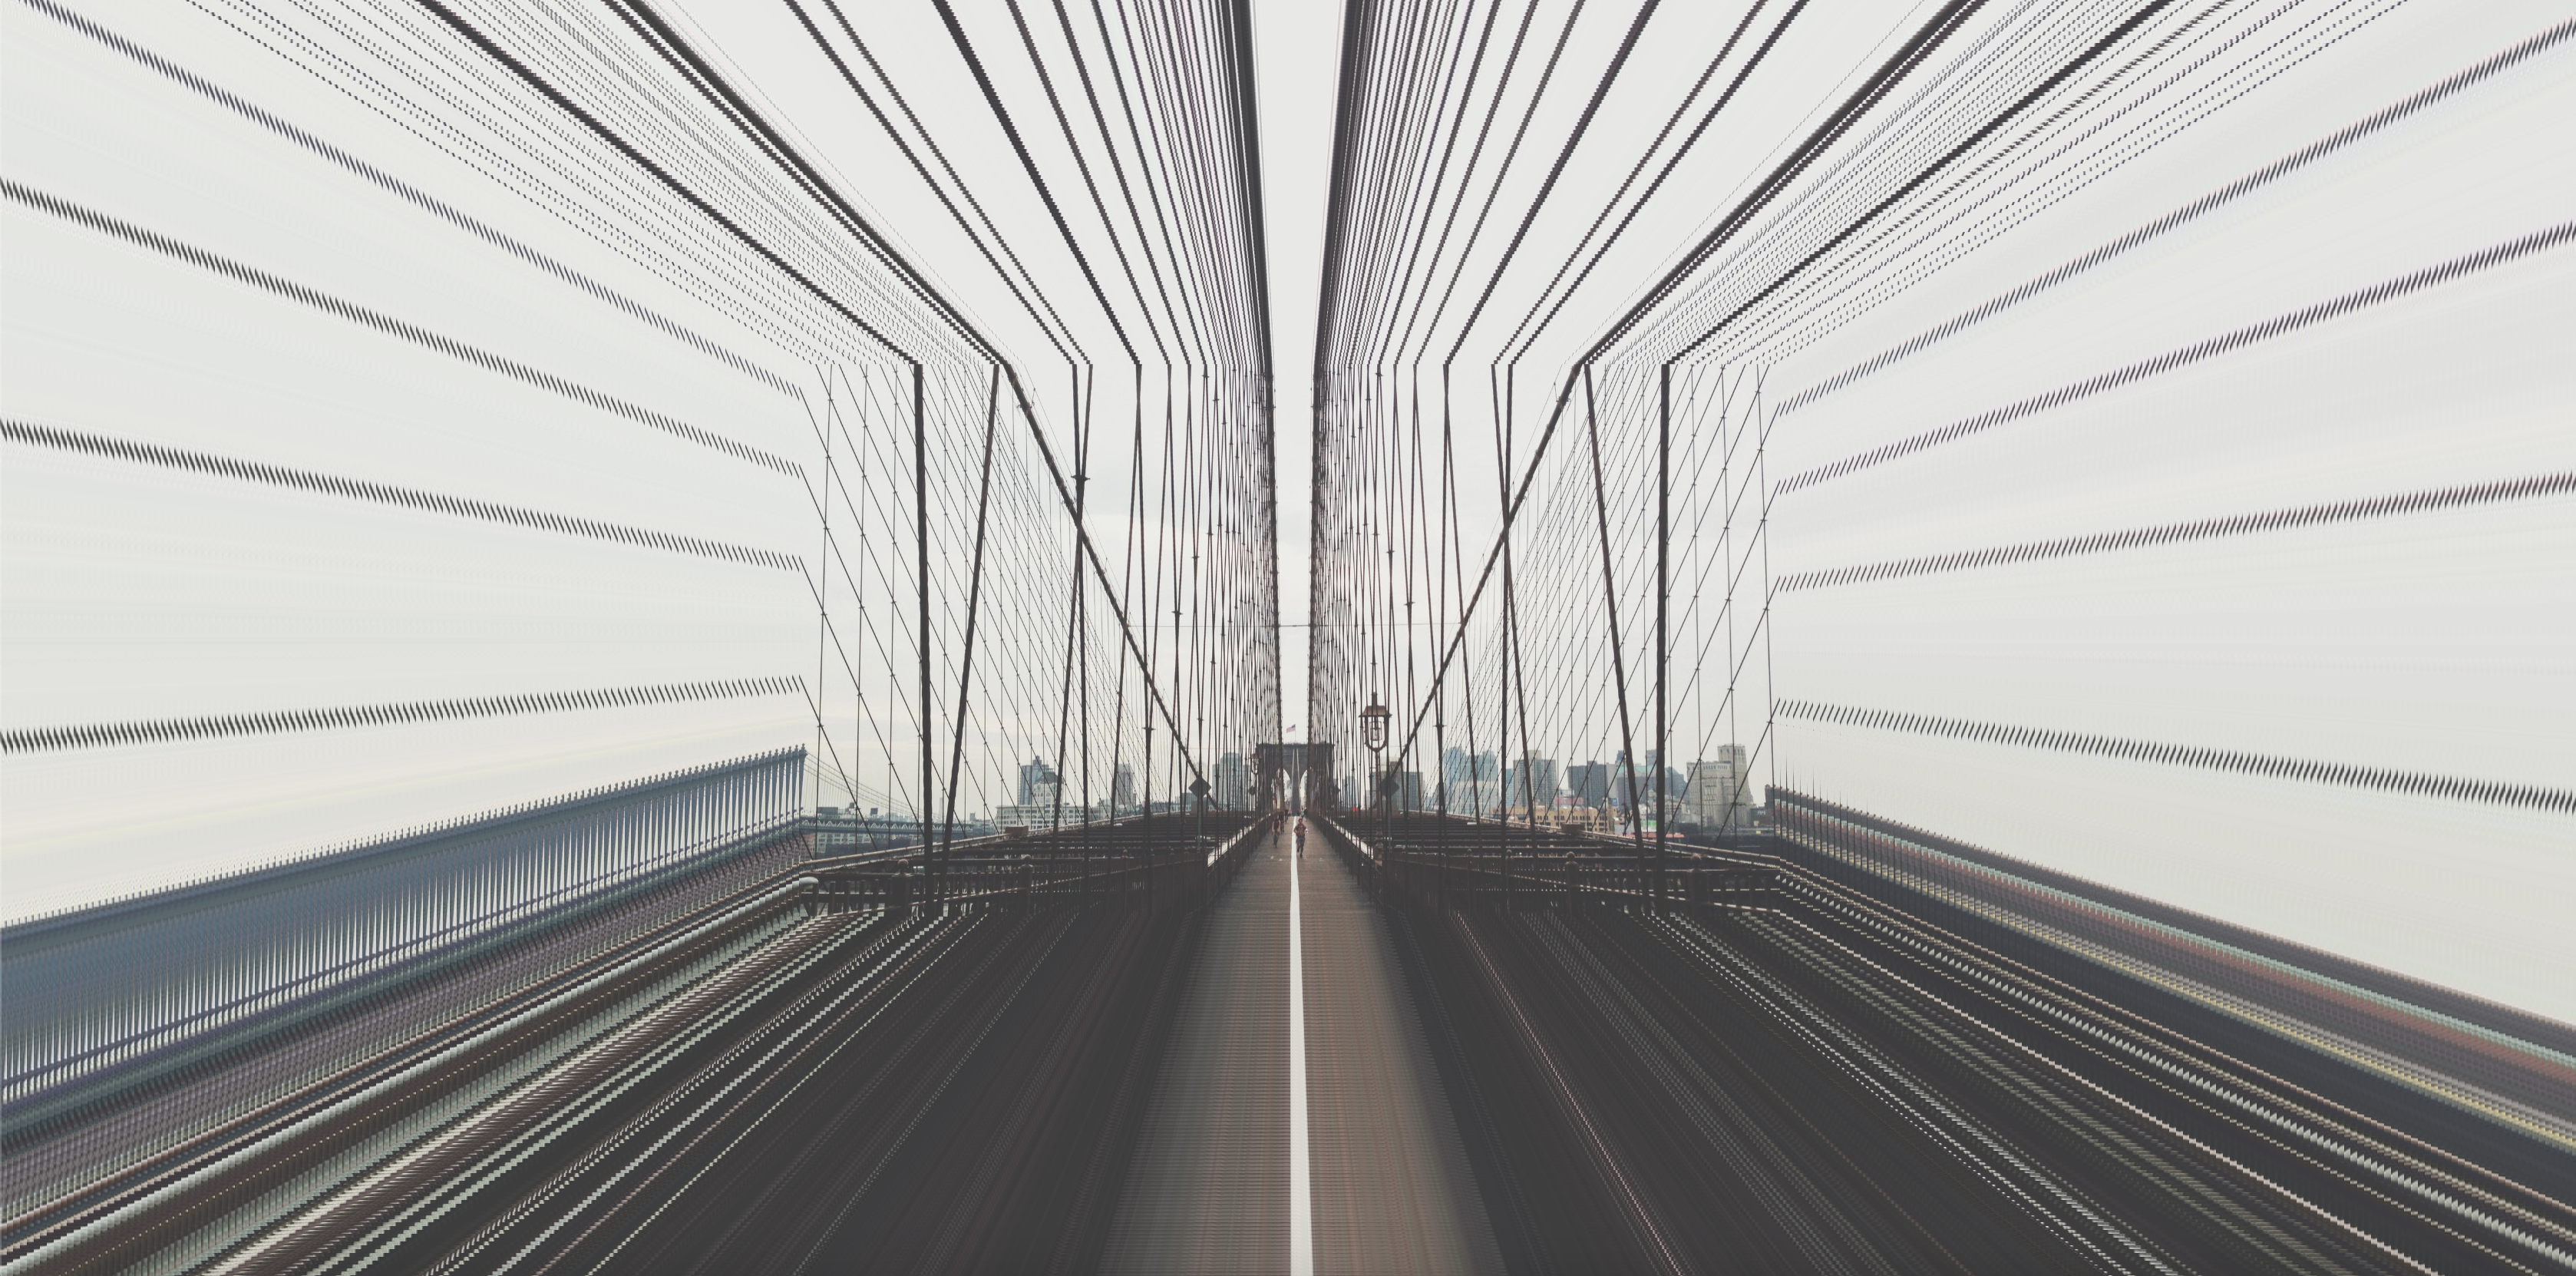
# Repeating images
Maak een folder images_repeating aan met de mappenstructuur uit p5.js introductie. Deze applicatie genereert een aantal instanties van dezelfde afbeelding waarvan de grootte steeds verandert (kleiner worden na iedere iteratie). De afbeelding wordt geladen via de online service https://picsum.photos. Deze service genereert afbeeldingen on the fly waarin we o.a. de dimensies en randomness kunnen opgeven, bijv.: https://picsum.photos/1920/1080?random=1 (genereet een random afbeelding met een breedte van 1920 pixels en een hoogte van 1080 pixels).
Resultaat:
 **Oplossing**:
./artevelde/pgm-code/pgm-1/week-2/repeating_images.js
// The variable imagePath contains a string as value to an online service for random images
const imagePath = "https://picsum.photos/1920/1080?random=1";
let img,
  amount = 120,
  i = 0,
  ratio = 1;

// The preload function from p5.js will be executed before the setup() and draw() function
function preload() {
  img = loadImage(imagePath); // Load the image and store it in the variable img
}

function setup() {
  createCanvas(windowWidth, windowHeight);

  background(0);

  translate(width / 2, height / 2); // Move to the center of the screen
  imageMode(CENTER); // Set the zero-point to the center of the image

  // Calculate the maximum scale based on the image dimensions and the dimensions of the canvas
  const scale = Math.max(width / img.width, height / img.height);

  // Loop through the defined amount
  for (let i = 0; i < amount; i++) {
    const w = (img.width - i * 10) * scale; // Calculate the width of the images based on the original width, the iterator i and the scale
    const h = (w * 1080) / 1920; // Calculate the height based on the width and the ratio
    image(img, 0, 0, w, h); // Draw the image based on the calculated width and height
  }

  noLoop();
}
2
3
4
5
6
7
8
9
10
11
12
13
14
15
16
17
18
19
20
21
22
23
24
25
26
27
28
29
30
31
32
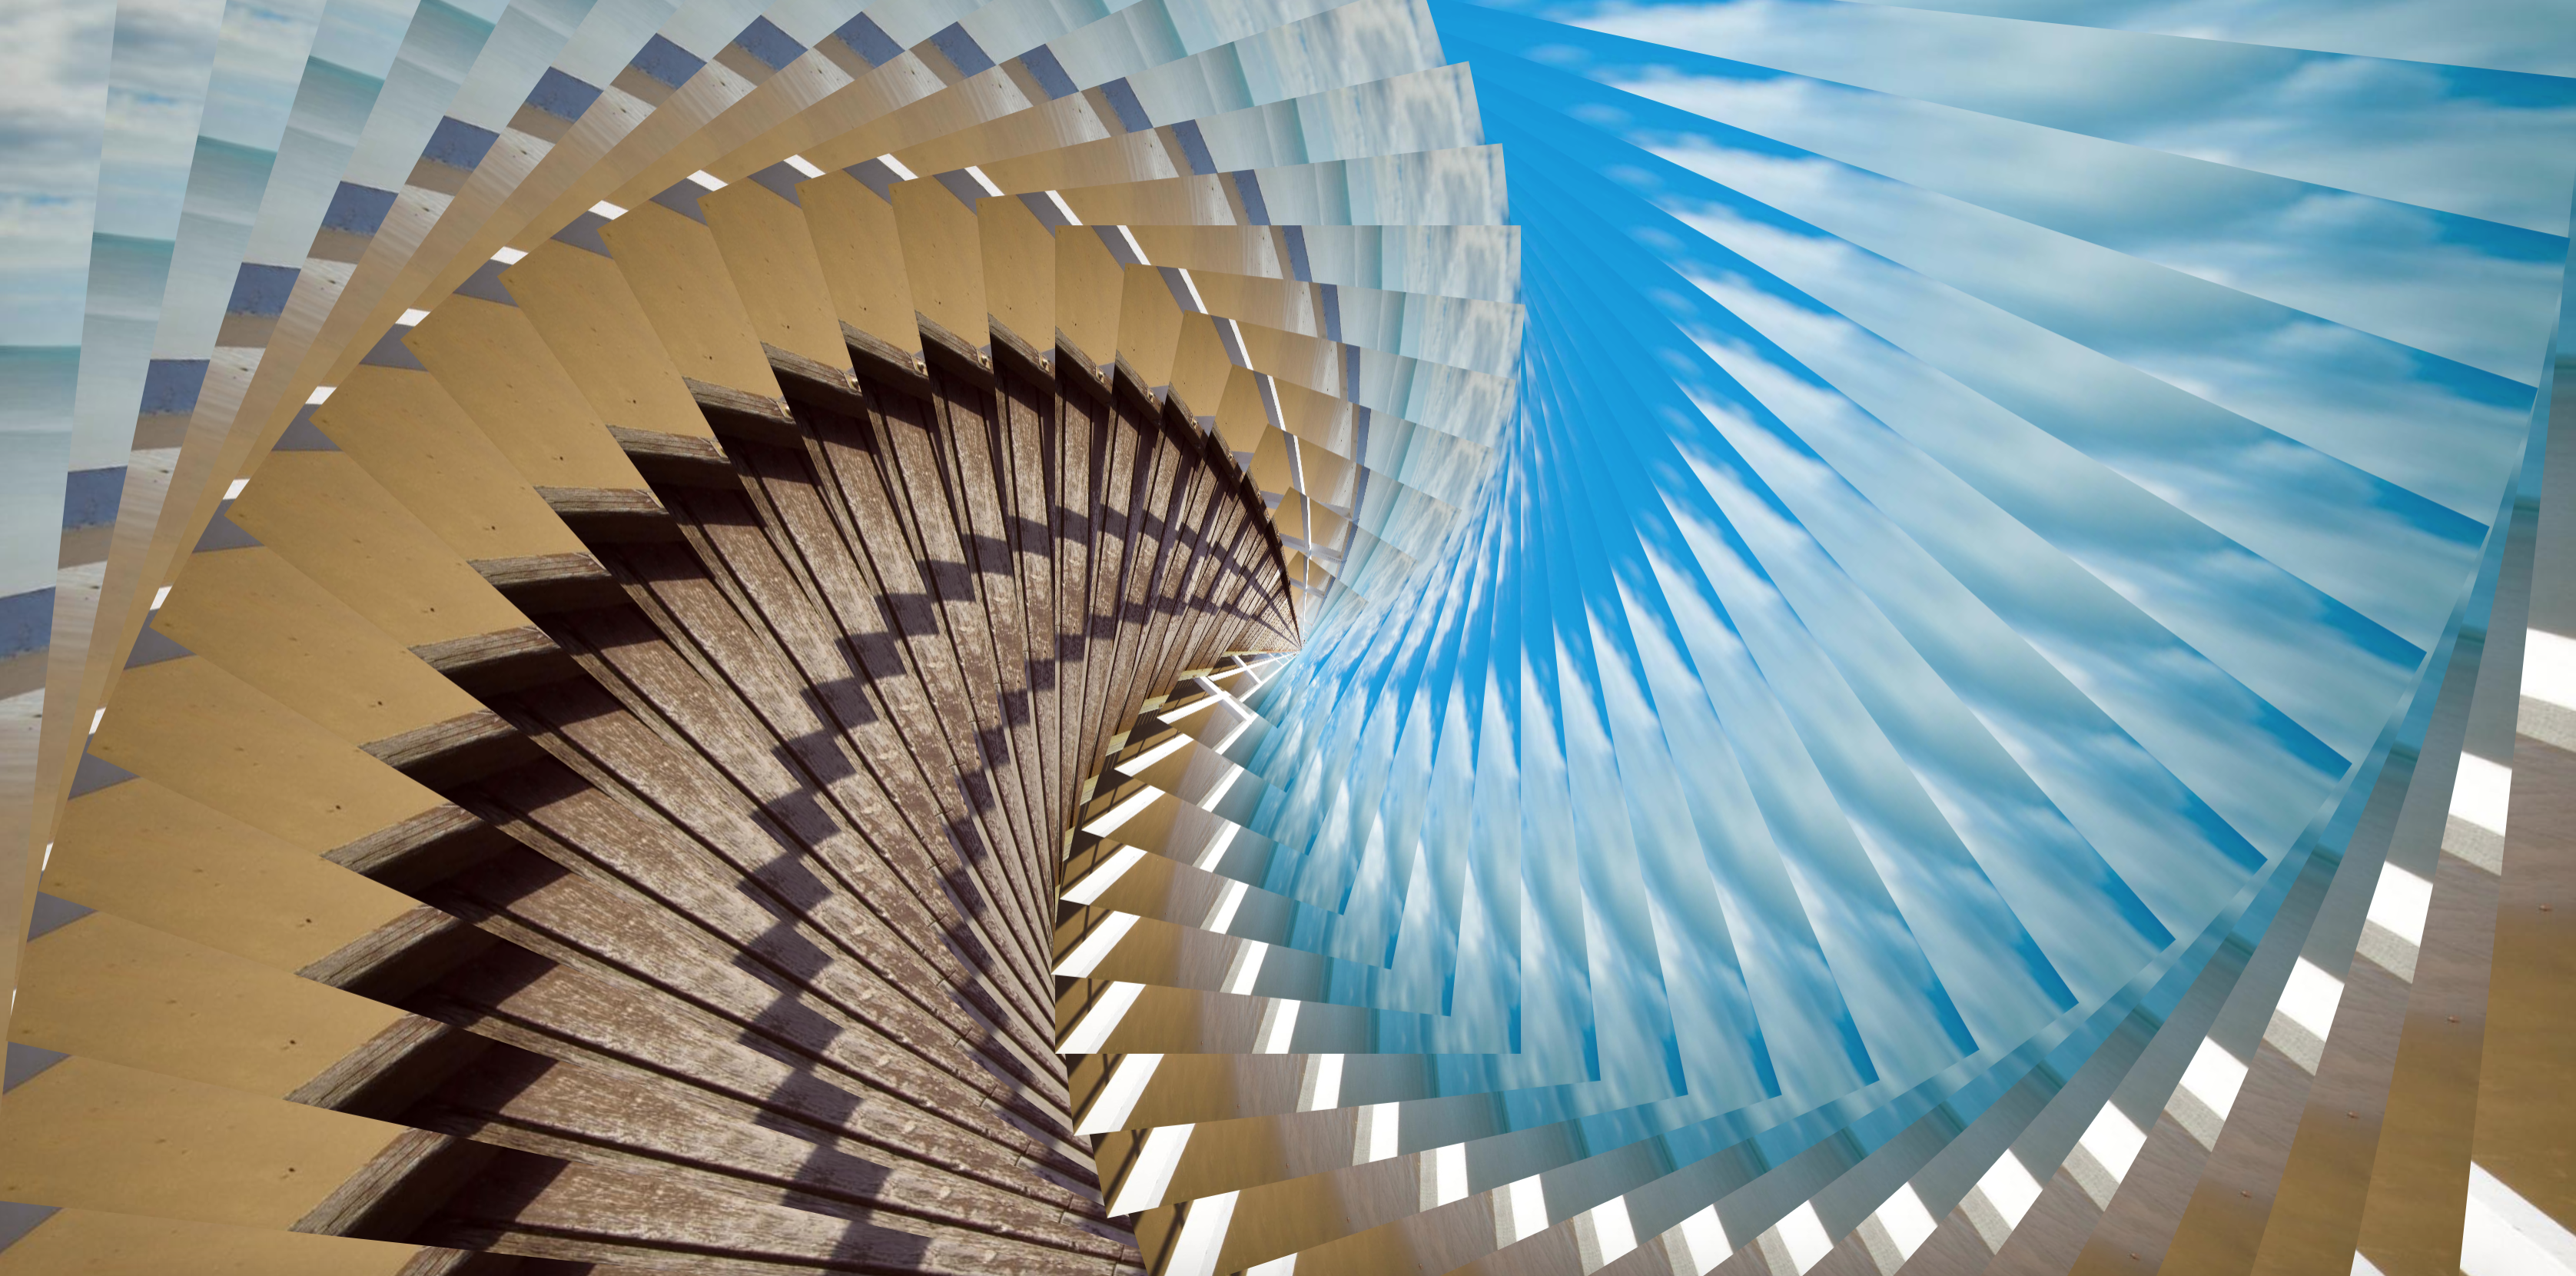
# Rotating repeating images
Maak een folder images_repeating_rotating aan met de mappenstructuur uit p5.js introductie. Deze applicatie genereert een aantal instanties van dezelfde afbeelding waarvan de grootte steeds verandert (kleiner worden na iedere iteratie en met een toenemende rotatiehoek). De afbeelding wordt geladen via de online service https://picsum.photos (laden op dezelfde manier dan de voorgaande oefening).
Resultaat:
 **Oplossing**:
./artevelde/pgm-code/pgm-1/week-2/rotating_repeating_images.js
// The variable imagePath contains a string as value to an online service for random images
const imagePath = "https://picsum.photos/1920/1080?random=1";
// Definition of the variable img (load an image from an external service)
let img;

function preload() {
  img = loadImage(imagePath);
}

function setup() {
  createCanvas(windowWidth, windowHeight);

  background(0);

  translate(width / 2, height / 2);
  imageMode(CENTER);
  angleMode(DEGREES); // Set the angle mode to DEGREES in p5.js

  // Calculate the maximum scale based on the image dimensions and the dimensions of the canvas
  const scale = Math.max(width / img.width, height / img.height);
  let angle = 0,
    i = 0,
    ds = 1,
    w = (img.width - i * 10 * ds) * scale,
    h = (w * 1080) / 1920,
    d = (width / 100) * 8;

  do {
    push(); // Save the current drawing styles
    rotate(i * 6); // Rotate an image based on the iterator i
    image(img, 0, 0, w, h);
    pop(); // Restore the drawing styles

    i++; // Increment the iterator
    ds *= 0.998; // Decrease the value of the scaling speed
    w = (img.width - i * d * ds) * scale; // Decrease the width
    h = (w * 1080) / 1920; // Calculate the height of the image based on the width and the ration
  } while (w > 20 && h > 20); // Repeat the do…while loop until the condition is false
}
2
3
4
5
6
7
8
9
10
11
12
13
14
15
16
17
18
19
20
21
22
23
24
25
26
27
28
29
30
31
32
33
34
35
36
37
38
39